• About

worldvolatility

Author Archives: Daniel

Worldvolatility at 4,59% in USD terms

12 Tuesday Dec 2017

Posted by Daniel in Uncategorized

≈ Leave a comment

The Worldvolatility have taken a sharp step down with equityvolatility hitting historical lows. The volatility of the treasuries are approaching really low levels but still have some way to go to historical lows sat at July 14th 1978. Back then the extreme calm of the treasuries were followed by extreme monetary events in the following years with the Worldvolatility spiking at 17,53% in October 15th 1982. In the close-up below (bottom graph) we can see that if the Worldvolatility is moving any lower now it is likely to approach the historical lows around 4% for the 9th time since 1974.

Advertisement

Worldvolatility at 5,47% in USD terms

03 Tuesday Oct 2017

Posted by Daniel in Worldvolatility

≈ Leave a comment

The Worldvolatility still resides in the lower range of the uptrend that started in 2014. A low reading at 5,27% occured in the beginning of July before the North Korea story broke out. The Worldvolatility stands today at 5,47%. The period since 2014 is starting to look a lot like the late 1990s. Back then the Worldvolatility went sharply from around 6% to 8% before Nasdaq broke in March of 2000. A sharp increase(say before Q4 2018) up to 8% from where we are now would look a lot like 1999 all over again. Right now it is too early to say if this will happen.

Worldvolatility at 5,59% in USD terms

17 Wednesday May 2017

Posted by Daniel in Worldvolatility

≈ Leave a comment

The risk parity weighted asset volatility (the Worldvolatility) stands at 5,59%. This is clearly within the normal range since the early 1970s. The 8th low at around 4% since 1974 occured in 2014 and from this low reading a clear uptrend can be seen until today. This can still be seen as mean reversion and the Worldvolatility have many levels to pass on the upside before it can be said to be high. In other words: -We live in a “normal” world at the moment resembling the late 1990s.

Asset volatility increasing slightly now at 5,47% in USD terms

15 Wednesday Feb 2017

Posted by Daniel in Uncategorized

≈ Leave a comment

Asset volatility is still increasing very slowly but surely and has been in uptrend since 2014. Trump winning the US election did not change the direction of volatility and the latest increase is mostly because of a treasury sell-off. Asset managers are still experiencing “the wind increasing slightly as time passes”.

feb15th-2016

The risk parity weighted asset volatility

21 Sunday Aug 2016

Posted by Daniel in Uncategorized

≈ Leave a comment

The path towards creating a worldvolatility have now reached the stage of an assetportfoliovolatility. The portfolio assets are :US 10 year treasuries, NASDAQ and gold. The portfolio is risk parity weighted and weekly rebalanced to capture actual experienced voll by the biggest asset managers in the world.

The last little increase looks small but captures the uptick in volatility after Brexit. The next phase towards worldvolatility will be some method to capture changing monetary regimes, with the China SDR inclusion in late 2016 being an example of a change of this type.

Aug21th 2016

Nasdaq+10y treasury portfolio volatility: 5-20%

09 Wednesday Mar 2016

Posted by Daniel in Uncategorized

≈ Leave a comment

The 50-50 Nasdaqcomposite-10y treasury  continually dollar-rebalanced portfolio shows a range for the the historical volatility. 5% sets a floor in the post bretton-woods world. 20% annual volatility seems to be as bad as it can get at least in dollar terms. The equity market and the treasury market represent the most important claims in the financial world and in dollar terms they only deviate this much for the holder of the 50-50 portfolio. These claims can be said to be proxies for claims on the american public and private sectors respectively. For the holder of claims on both sectors the volatility moves in this range: 5-20%.

2016-03-09

Historic check of treasury and equity volatility since 1973

19 Thursday Nov 2015

Posted by Daniel in orientation, relative volatility

≈ Leave a comment

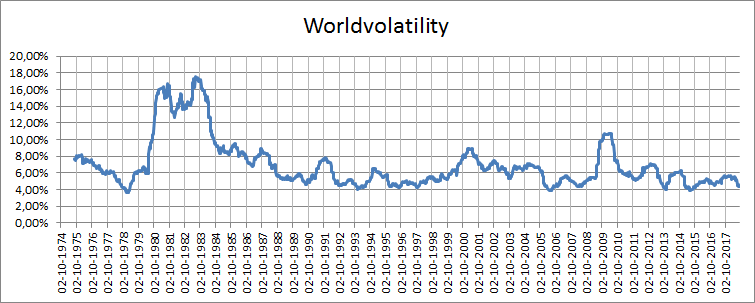
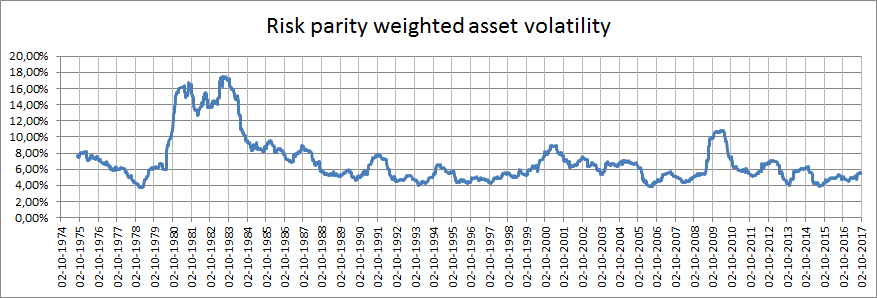
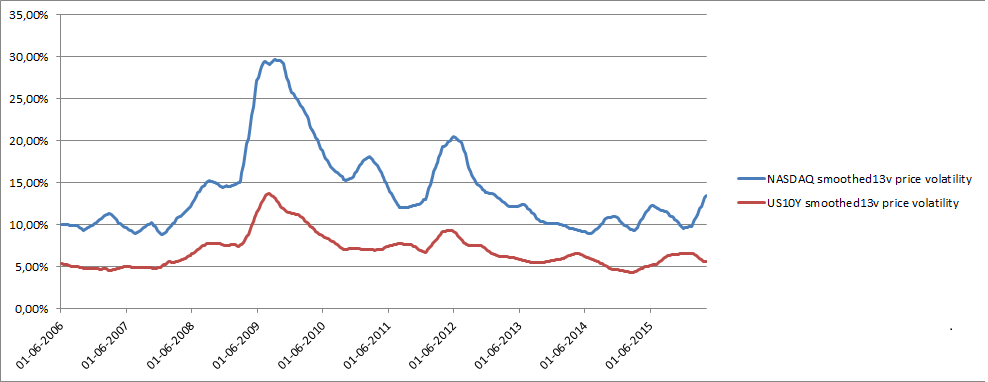
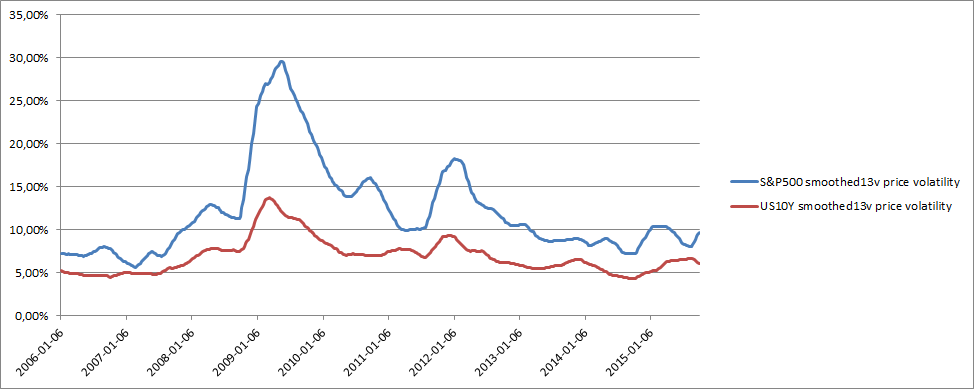
The historic check of Nasdaq and 10year-treasury volatility shows a range of normality for these measures. Treasury volatility seem to be “calm” around 5% and that sets somewhat of a floor. Nasdaq volatility seems to have around 10% as a floor at least in post-coldwar world from the nineties and forward. Upper level obviously harder to pinpoint. Both these series are slightly leptokurtic (fat tail distributed) with Treasuries being more leptokurtic over the 42 year period with only one big spike in volatility.

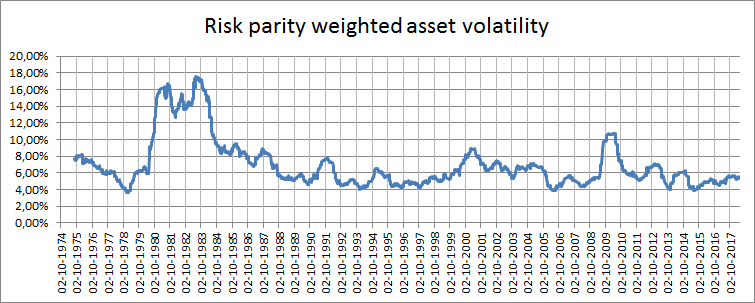
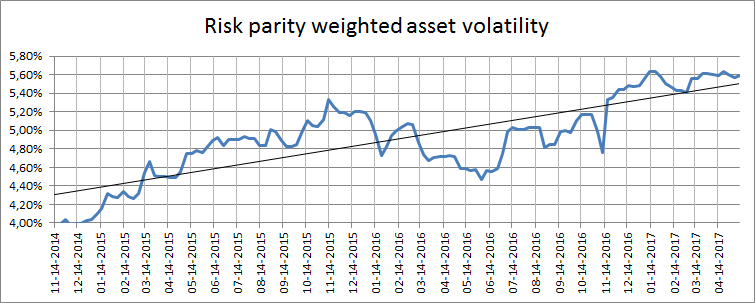
The series looks to be working in “alternating-fashion” in a way with big spikes in one being “safeguarded” by calm in the other. This being brought about by portfolio manager behaviour and central bank behaviour over different periods with different investing fashions in vogue, for example the Volcker-moves of the early eighties by Fed and risk parity investing today.

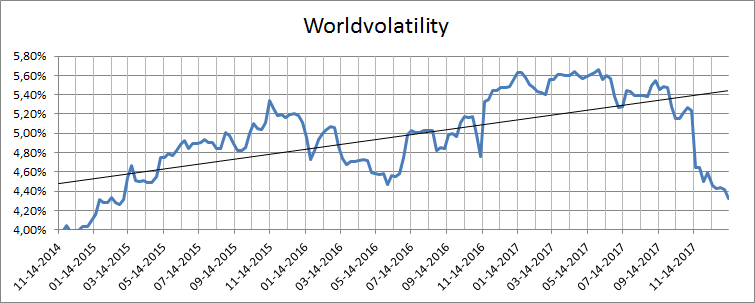
Is this a reasonable basis for a “worldvolatility”? After researching financial time series and various kinds of societal time series for 20 years my view is that it is.

/Daniel


2015-11-19-1973

Equity volatility continuing upward

19 Thursday Nov 2015

Posted by Daniel in relative volatility

≈ Leave a comment

S&P500 volatility changed to Nasdaqcomposite volatility as benchmark for dollar denominated equity volatility. Nasdaqvolatility is leading changes in S&P500 volatility on a number of occasions in the last 40 years that is the reason for the change. Just like S&P500 it has been moving upward in the last weeks. Treasury volatility moving close to historic lows and opposite to equity volatility in the last weeks. Uncertainty about Fed rate hike cycle might be somewhat less than a month ago and might contribute to lower treasury volatility. Both volatilities are always scaled to yearly volatilities for comparison.

2015-11-19


Equity volatility rising

08 Thursday Oct 2015

Posted by Daniel in relative volatility

≈ Leave a comment

After the Yuan devaluation and very difficult times for many emerging markets, the Volkswagen scandal hits and the equity volatility rises. VIX also seems to be finding a new higher normal around 20-25 after spikes >30. Treasury volatility calmer than equity in this environment and not reacting as much to the upside. One factor that keeps treasuries calmer is the fact that in Yuan terms the return is a little bit better after the devaluation.

2015-10-08

Equity and bond volatility converges

04 Tuesday Aug 2015

Posted by Daniel in relative volatility

≈ Leave a comment

2015-08-04

The converging volatilities indicate more focus on the bond markets over the summer. The general asset volatility level is rising.

← Older posts
Newer posts →

Subscribe

  • Entries (RSS)
  • Comments (RSS)

Archives

  • February 2022
  • December 2020
  • March 2020
  • October 2019
  • January 2019
  • August 2018
  • June 2018
  • February 2018
  • January 2018
  • December 2017
  • October 2017
  • May 2017
  • February 2017
  • August 2016
  • March 2016
  • November 2015
  • October 2015
  • August 2015
  • January 2015
  • October 2014

Categories

  • orientation
  • relative volatility
  • Uncategorized
  • VIX
  • Worldvolatility

Meta

  • Register
  • Log in

Blog at WordPress.com.

Privacy & Cookies: This site uses cookies. By continuing to use this website, you agree to their use.
To find out more, including how to control cookies, see here: Cookie Policy
  • Follow Following
    • worldvolatility
    • Already have a WordPress.com account? Log in now.
    • worldvolatility
    • Customize
    • Follow Following
    • Sign up
    • Log in
    • Report this content
    • View site in Reader
    • Manage subscriptions
    • Collapse this bar
 

Loading Comments...