Worldvolatility at 5,50% in USD terms

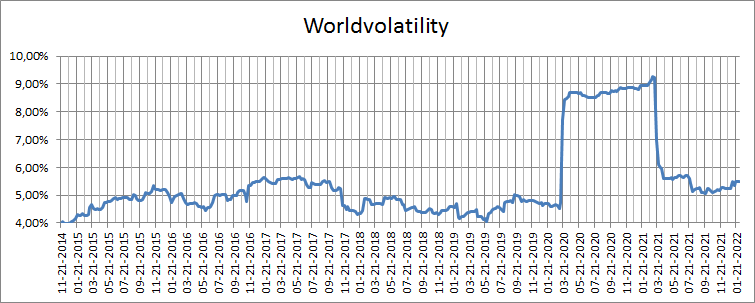
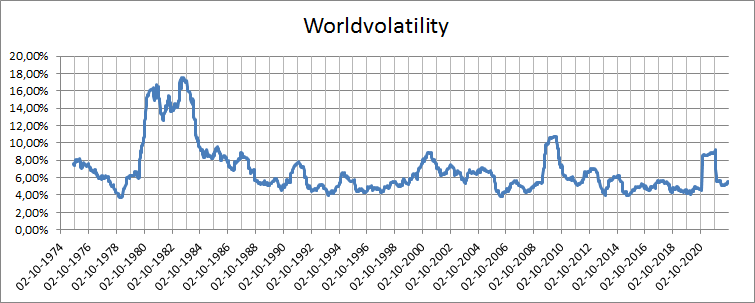
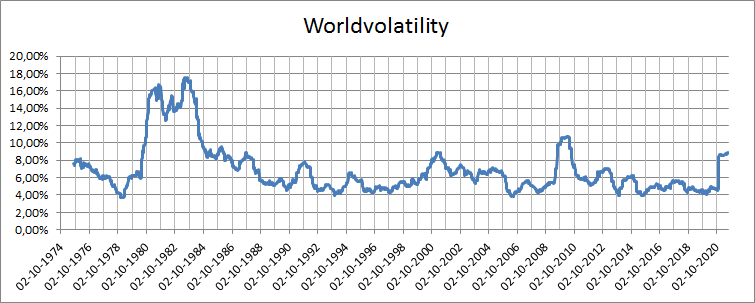
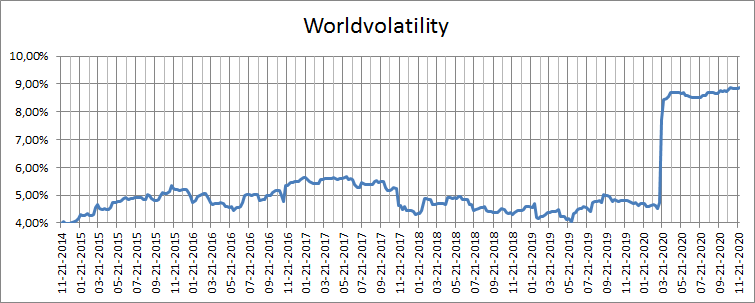
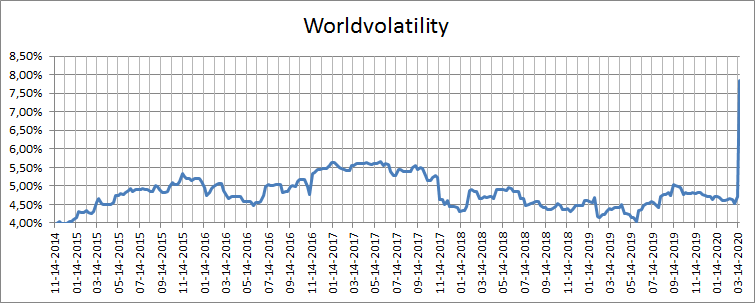
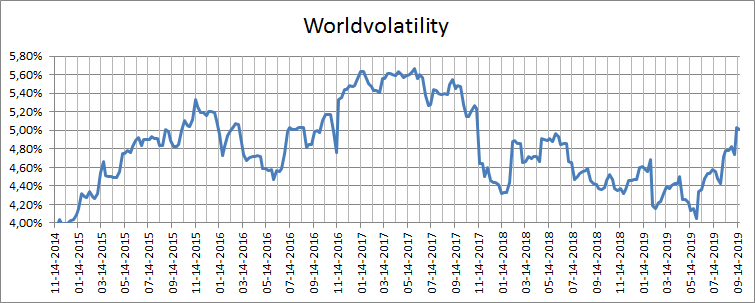
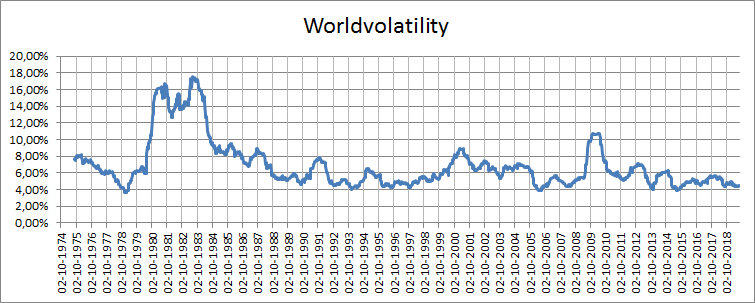
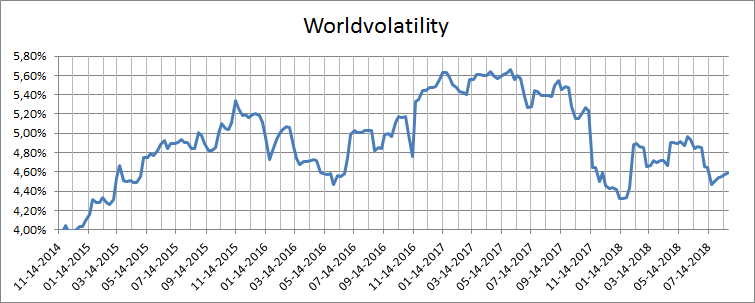
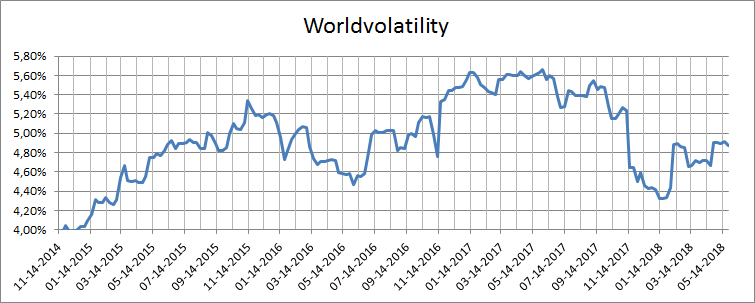
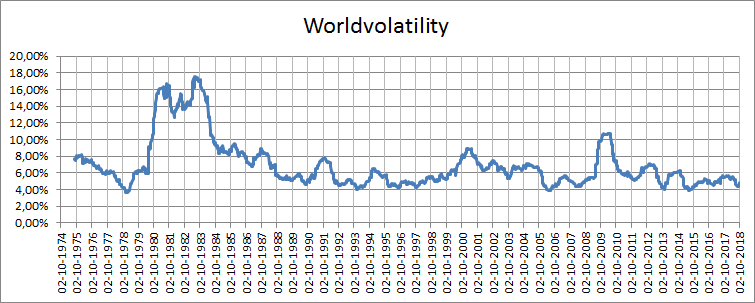
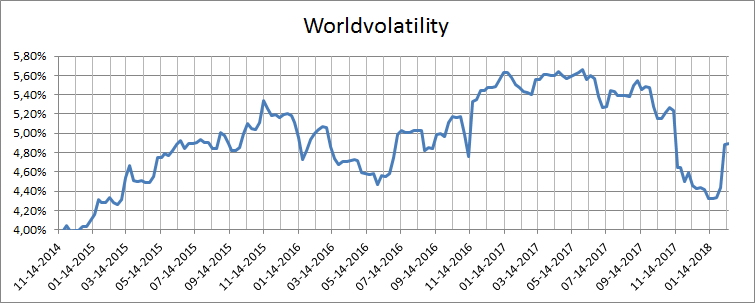
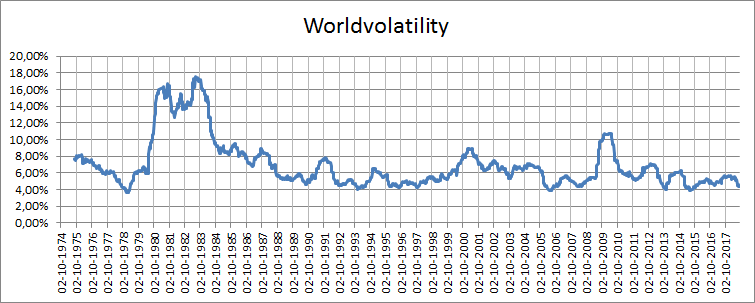
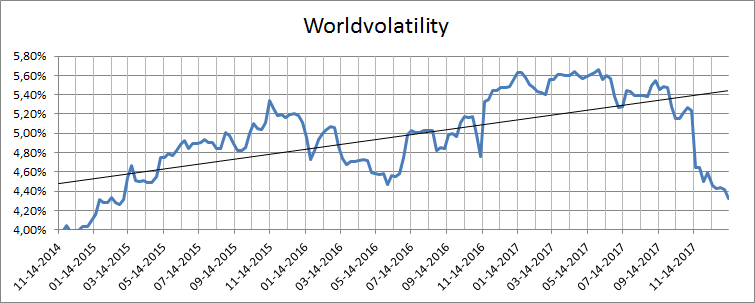
US inflation have reached early 80´s levels for two consecutive months now with energy prices taking the lead. This has lead to a new situation for central bank policies around the world. Monetary tightening is coming but the question is how much and when. BOE were first out with the Fed likely to act in March. The treasury markets are still calm waters but have started a little bit of a selloff. What contributes here is of course way smaller (or none at all) QE buying than in the last couple of years. Equity markets have had a rough start to 2022 but not enough to upset the Worldvolatility.

Worldvolatility at 8,87% in USD terms

With the presidential election behind us the equity markets have seen new highs and gold have fallen back a little. The treasury rates are still at low levels but have been edging up as of late.

The Worldvolatility have been drifting up during 2020 and that is mainly due to a lower diversification effect in the capital markets than the historical norm. The Worldvolatility portfolio (Treasuries, Gold, Equity) is more volatile than what the individual assets would tell you. (asset volatilities: 10 year- Treasury bond: 6,5%, Gold: 16,5%, NASDAQ Composite: 25,2%)

Worldvolatility at 7,84% in USD terms

It took a pandemic to move the Worldvolatility to the highest since 2008. At 7,84% all assetclasses are quite volatile and the implied correlation is rising. Equities and Goldmarkets are wild but treasuries are still reasonably calm thanks to heavy fed intervention.

An interesting peculiarity that the worldvolatility has is that it can rise fast but normally will not decrease as fast. At these levels (7,84%) it is more likely to remain high for at least a couple of months than to decrease.

The level a the moment is still way below the early 1980s and 2008-2009 both with a Worldvolatility above 10% as can be seen below. The level at the moment is not at a systemic risk level, but a further increase of the Worldvolatility in the coming months could pose a systemic risk to the USD based financial system.

Worldvolatility at 5,00% in USD terms

The Worldvolatility have turned up fast over the summer from almost 4% up to 5% now in October. Gold have started to climb and have reached new highs in some currencies but not in dollar terms yet. The treasury rates have been once again at lows (1,5%) and turned up a little lately. Overall all three assets that make up the Worldvolatility basket (equity, treasuries, gold) are still historically calm. The way that brexit unfolds might move some assets or regions. Time will tell if it really will have an effect systemwide and if that happens the Worldvolatility will move up.

Worldvolatility at 4,47% in USD terms

After some big moves in the equity markets to end the year the Worldvolatility is still at the low level of 4,47% in USD terms. The gold and treasury markets have remained calm in the face of equity turmoil. The level of the long interest rates will be important in the coming year. If the interest rates increase at a steady pace the volatility in the whole financial system can still remain at this low level of 4,47%. A quick sell off in the treasury market would be another story of course.

Worldvolatility at 4,59% in USD terms

After all-time highs in the big equity markets and news about the longest bull market in history, the Worldvolatility have declined. The major thesis is still that the Worldvolatility will touch 4% before any major financial storm. The treasury market is very calm at this point, having a volatility of only 1/6th of its all time high sat at Dec 18th 1981.

Some readers might wonder why 4% is often mentioned here at Worldvolatility. That is because the Worldvolatility have turned up very close to 4% eight times since 1974. This have only happened in good times often before market tops.

That is an empirical fact in the post Bretton-Woods era.

On a more philosophical level the 4% might represent the minimum dynamism needed in a market economy, anything lower would be possible in a planned economy maybe, but not in a market driven capitalistic society.


Worldvolatility at 4,89% in USD terms

After a wild February in the equity markets the Worldvolatility have risen to 4,89% in USD terms. The move felt dramatic and some reverse VIX ETF:s have been wiped out. In situations like this the Worldvolatility can sort out wheter the move is significant for the financial system as a whole. The short answer is that it has not been a dramatic move when looking at gold, treasuries and equity like Worldvolatility does. The increase in the level of the Worldvolatility is there but the dramatic move in the equity markets have been cushioned by far smaller moves in treasuries and gold.

4,89% is a low level historically as we can see below.

Why truncation of x axis in bottom graph at 4%?

Answer to readers about graphs:

The top graph shows the evolution of the worldvolatility since 1974. An empirical observation that can be easily seen is that the values seem to stop decreasing around 4%. Why at 4%? That is unknown at this point, but it seems to hold as a worldvolatility low.

The bottom graph is just a zoom (in the long graph from 1974) from the last time the worldvolatility hit a 4% low , which was in the summer of 2014. The truncation of x axis at 4% is just to get a close up on the evolution of the worldvolatility.

So both graphs show the same evolution of the Worldvolatility, the bottom one being the close-up and the top one being the “big picture” from 1974.