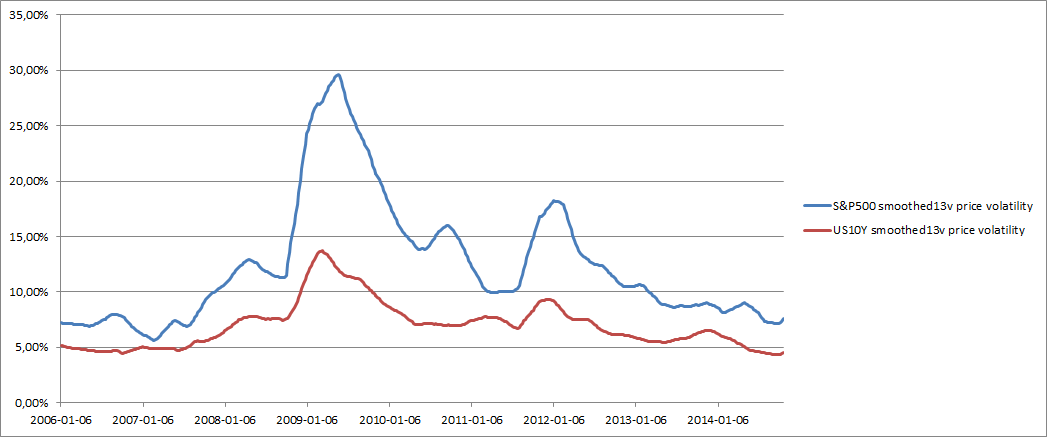
“Changes in the volatilities of different asset classes are significantly positively correlated,” says Ray Dalio and it seems from the Picture above that there seems to be more than an ounce of truth in that. With a correlation of 0,96 anchoring the volatility of S&P500 and 10 year treasuries in the last 8 years, it seems quite uniformly dispersed across asset classes, at least for equity and treasuries. The absolute level of volatility is harder to explain, for example the peak in 2009. One of the main pillars of “Risk parity investing” is that the relative volatilities hold under different economic environments. (The relative volatility of S&P500 and US10Y is averaging 1,73 above, this implies an average structural duration for Equity of about 27,2 years. With the 10 year treasury having a duration of 9,1 years and volatility being proportional to the Square root of time. 9,1*1,73^2=27,2 years). Risk parity investing seems to make sense at least over this short period of time (2006-2014).Even if the absolute level of volatility is not needed in risk parity investing it is still very fascinating and might capture some societal dynamics unknown today.
